

| Cellular and Molecular Medicine Research, ISSN 2817-6359 online, Open Access |
| Article copyright, the authors; Journal compilation copyright, Cell Mol Med Res and Elmer Press Inc |
| Journal website https://www.thecmmr.org |
Original Article
Volume 1, Number 2, December 2023, pages 61-72

WNIN Mutant Obese Rats Develop Acute Pancreatitis With the Enhanced Inflammatory Milieu
Himadri Singha, Rajanna Ajumeeraa, Venkata Malakapallia, Maniprabha Chalasania, Suresh Pothanib, Vijayalakshmi Venkatesana, c
aBiochemistry/Stem Cell Research, National Institute of Nutrition (ICMR), Hyderabad, India
bNational Centre for Laboratory Animal Sciences, National Institute of Nutrition(ICMR), Hyderabad, India
cCorresponding Author: Vijayalakshmi Venkatesan, Department of Biochemistry/Stem Cell Research, National Institute of Nutrition (ICMR), Tarnaka, Hyderabad 500007, India
Manuscript submitted May 20, 2023, accepted June 18, 2023, published online November 7, 2023
Short title: Pancreatic Stress in WNIN/GR-Ob Mutant Rats
doi: https://doi.org/10.14740/cmmr11e
| Abstract | ▴Top |
Background: WNIN/Gr-Ob rats demonstrate features of metabolic syndrome that include obesity, insulin resistance, impaired glucose tolerance, and hyperinsulinemia. The impetus obtained from earlier studies on these rats demonstrates an inflammatory milieu peaking between 6 and 9 months of age in adipose, pancreas, and bone marrow/mesenchymal stem cells.
Methods: We evaluated the outcome of L-arginine-induced acute pancreatitis, in WNIN/Gr-Ob rats as compared to control rats. We assessed key parameters associated with severity of acute pancreatitis such as pancreatic inflammation and extra-pancretic damage.
Result: We demonstrated increased pancreatic inflammation (inflammatory cytokines, malondialdehyde, and reactive oxygen species) in WNIN/Gr-Ob rats as compared to the control rats administered with L-arginine. Increased systemic inflammation and islet dysfunction were also observed in WNIN/Gr-Ob rats as compared to control when L-arginine was administered. Molecular, cellular and biochemical data from our study indicate increased severity of pancreatitis in mutant rats as compared to control rats.
Conclusion: We advocate WNIN/Gr-Ob rats as a novel model system to study the pathophysiology of severe acute pancreatitis associated with obesity.
Keywords: WNIN/GR-Ob mutant rats; Islets; Pancreatitis; Endocrine-exocrine cross-talk
| Introduction | ▴Top |
Acute pancreatitis (AP) is a necro-inflammatory disease of pancreas [1]. AP is also associated with secondary complication - extra-pancreatic tissue damage. Patients diagnosed with AP have a greater chance to develop pre-diabetes/diabetes [2]. The precise mechanism of acute pancreatitis remains controversial [3]. Current studies have demonstrated that the chronic endoplasmic reticulum stress and oxidative stress play an important role in development and progression of AP [4, 5].
The L-arginine-induced pancreatitis is widely used as a relevant model for pre-clinical trials because 1) it is reproducible, 2) it shows dose and time dependent acinar cell necrosis, 3) it can be used for investigation of early as well as late phase of acute pancreatitis, and 4) it is suitable for investigation of extra-pancreatic organ damage (pulmonary, hepatic renal and circulatory) and insulo-acinar axis [3]. The selective destruction of acinar cells by high dose of L-arginine may be partly attributed to disruption of protein metabolism, increased oxidative stress, and endoplasmic reticulum stress [6].
Obesity and metabolic syndrome (MS) are prognostic factors for severity of AP [7]. Severity of pancreatitis in obesity may be attributed to increased oxidative stress, free fatty acid production, fat necrosis and increased inflammation [8]. Studies by Mateu et al (2014) demonstrated that inflammatory responses in acinar cells were caused by enhanced recruitment of leukocytes that was mediated by increased secretion of pro-inflammatory molecules generated from adipose tissues [8].
The WNIN/GR-Ob rats, developed indigenously at National Centre of Laboratory Animal Sciences Facility of National Institute of Nutrition, India, are relatively a new model of MS having features of obesity, insulin resistance and glucose intolerance [9, 10]. The mutation linked to obesity has been mapped to chromosome 5 upstream of leptin receptor [11, 12]. These WNIN/Gr-Ob rats also portray accelerated aging, with increased episodes of obesity-associated neuro-degeneration, cataract, cancer, infection and infertility at advanced age [13]. Our previous studies have demonstrated increased inflammation in adipose, pancreatic tissue and mesenchymal stem cells isolated from bone marrow of WNIN/GR-Ob rats [14-16]. Based on these findings, we hypothesize that WNIN/Gr-Ob rats with their inherent phenotypic features such as obesity, IR and IGT vis-a-vis pre-inflammatory milieu in situ, would form the feasible model system to portray for the pathophysiology of AP induced by L-arginine. The biochemical, cellular and molecular changes were carried out along with morphology in both controls as well as with L-arginine induction.
| Materials and Methods | ▴Top |
Experimental animals
Animal experiments were approved by ethical committee on animal experiments at National Institute of Nutrition, Hyderabad, India (Regd. No. 154/1999/CPCSEA). The experiments were performed in compliance with “principles of laboratory animal care” (NIH publication no. 85-23, revised 1985). We restricted this study to 9-month-old rats (WNIN/Gr-Ob and control) based on findings from our earlier publication where increased pancreatic dysfunction was observed with age [17, 18]. WNIN/Gr-Ob and its parental control rats were used for the study. The animals were housed individually in polypropylene cages with wire mesh bottom, maintained at standard laboratory conditions of light (12-h light/dark cycle), temperature and relative humidity. They had free access to de-ionized water and standard rat chow.
WNIN/Gr-Ob as well as its parental controls were randomly allocated into four groups (six rats in each group) (Fig. 1): group 1: parental control rats treated with saline; group 2: parental control rats treated with L-arginine; group 3: WNIN/Gr-Ob rats administerd with saline; and group 4: WNIN/Gr-Ob rats treated with L-arginine. L-arginine hydrochloride was administered at a concentration of 350 mg/100 g body weight, dissolved in 0.15 molar saline as 20% solution. This concentration was selected as increasing concentration resulted in increased mortality in WNIN/Gr-Ob rats. L-arginine was administered (intra-peritoneal) at fed condition and the animals were sacrificed 48 h after treatment [19].
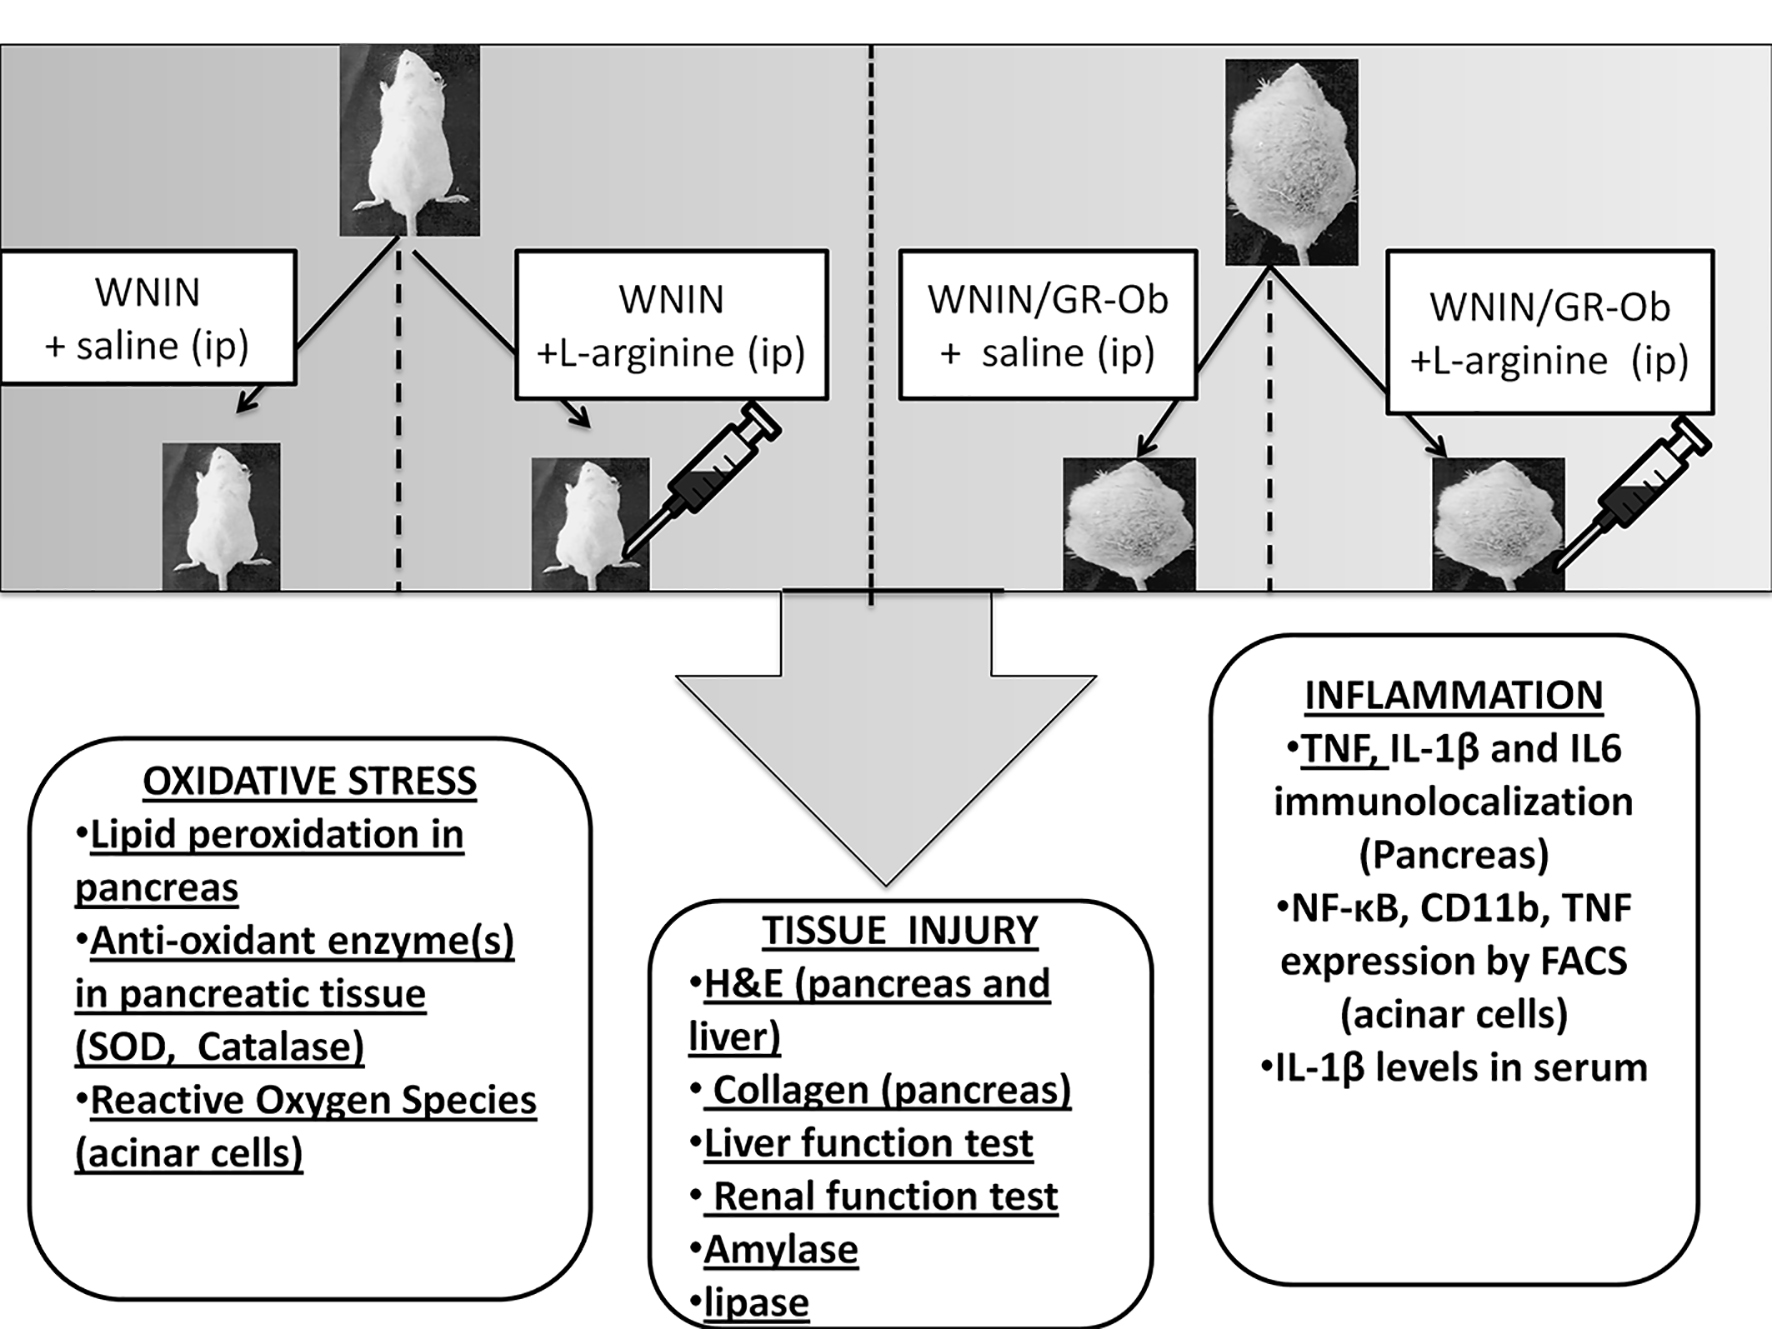 Click for large image | Figure 1. Schematic diagram of the protocol. WNIN/Gr-Ob and control rats were randomly allocated into four groups (six rats in each group). One group of WNIN/Gr-Ob and age-matched WNIN controls were administered L-arginine. Other two groups were WNIN/Gr-Ob and control rats that were administered saline. L-arginine was administered in fed condition and the animals were sacrificed 48 h after treatment. Parameters pertaining to oxidative stress, inflammation, pancreatic injury, islet and acinar cell functions were assessed. |
Biochemical measurements
Blood (2 - 3 mL) was collected by retro-orbital puncture from both control rats and experimental rats in pro-coagulant vacutainers (Genire Bio, Germany) and serum was stored at -70 °C. The animals were dissected immediately after the blood collection. Pancreatitis induction was assessed by measuring amylase and lipase levels in serum with ELISA multimode reader commercial kits (Erba Diagnostics, Hyderabad, India) and expressed in U/dL. Total pancreatic protein content was constituted in 10% homogenate by bicinchoninic acid protein assay kit (Product #BCA-1, Sigma) and expressed in mg/g tissue. Lipid peroxidation was estimated as thiobarbituric acid reacting substances (TBARS) in pancreas, lung and liver by the method described earlier and expressed in nmol/mg protein. The superoxide dismutase (SOD) activity was determined by the method described earlier [20]. In this test, the degree of inhibition of pyrogallol auto-oxidation by pancreas homogenate supernatant was measured. The change in absorbance was read at 470 nm against blank every 3 min on a spectrophotometer and the enzyme activity was expressed as 50% inhibition of adrenaline auto-oxidation/min. The SOD activity was normalized against protein concentration.
Catalase activity of tissues was assayed as described previously [21]. Briefly, the appropriate dilution of tissue supernatant was added to the cuvette containing 1.9 mL of 50 mmol phosphate buffer (pH 7.0). The final volume of the mixture was made up to 2 mL by adding additional buffer solution. The reaction was started by the addition of 1.0 mL of freshly prepared 30 mmol H2O2. The rate of decomposition of H2O2 was measured spectrophotometrically at 240 nm. The enzyme activity for H2O2 was expressed as k/s/mg protein, where k is the first-order rate constant. The SOD activity was normalized against protein concentration.
Liver functions were assessed using a panel of biochemical tests indicating liver inflammation (aspartate amino transferase and alanine amino transferase), cholestasis or biliary obstruction (total bilirubin and alkaline phosphatase) and synthetic function (albumin). Renal function was assessed by measuring the levels of blood urea nitrogen (BUN) and creatinine (Schiapparelli Biosystems, Wipro Biomed, USA).
Histology
Pancreas and liver were immediately fixed in neutral buffered formalin (10%) and embedded in paraffin by standard methods. The sections were then stained with hemotoxylene and eosine stain and were visualized and imaged under Nikon TE-2000S light microscope (Nikon, Japan) using ACT-2U software (version 2.1) (Nikon, Japan).
Immunofluorescence/immunohistochemistry
Formaldehyde fixed-paraffin embedded sections of the pancreatic tissue were processed for immunolocalization [22]. Briefly, after deparaffinization, the sections were dehydrated by passing through a series of decreasing concentration of ethanol. Permeabilization was done using 50% chilled methanol (v/v in water), and the sections were incubated at 37 °C for 1 h using 4% serum for the non-specific blocking. This was followed by overnight incubation with primary antibodies for IL-6 (Santa Cruz Biotechnology Inc., Santa Cruz, CA, USA), IL-1β (Santa Cruz Biotechnology Inc.), TNF (BD PharMingen, San Jose, CA, USA), collagen (Santa Cruz Biotechnology Inc.), and amylase (Santa Cruz Biotechnology Inc.) at a dilution of 1:100 in a humified chamber. After washes to remove excess unbound antibodies, samples were then incubated with the corresponding anti-rabbit or anti-goat secondary antibodies (Santa Cruz Biotechnology Inc.). The fluorescent images were visualized on Leica TCS SP5 series confocal microscope and quantitated as relative fluorescence unit (Leica, Mannheim, Germany). The immunostained sections stained with diamino benzoate (DAB), and counterstained with hematoxylene were captured using Leica CTR 4000 (Leica, Mannheim, Germany). Immunostaining intensity for collagen was quantified by determining the reciprocal intensity using Image J software [23]. The immunofluorescence was measured by Leica Qwin software.
Real-time PCR
Total RNA was isolated and cDNA was prepared as per the protocol of Venkatesan et al [16]. Primers were designed with the aid of PrimerQuest software (Integrated DNA Technologies, Coralville, IA, USA). PCR was carried out to analyze the expression of TNF-alpha. qPCR was performed using a CFX 96 touch real-time PCR system (Biorad, Italy). Samples were run as triplicates in a 96-well PCR plate (Biorad, Italy). Each assay (15 µL total volue) contained nuclease free water (5 - 10 µL), cDNA template (2 ng/µL), and gene-specific primers (4.5 pm/µL). Specificity of the PCR products was confirmed by the melting curve program with temperatures in the range of 60 - 95 °C with a heating rate of 0.5 - 0.05 °C/s and a continuous florescence measurement. The data were analyzed with biological replicates for each group and subtracting the Ct value of target gene from that of reference gene β-actin to obtain the ΔCt. We have used the unpaired t-test to yield the estimation of ΔΔCt [16]. Relative differences in gene expression between treatment with L-arginine (groups 3 and 4) were represented as fold change. The statistical significance (P < 0.05 by t-test) is indicated by an asterisk (*) and ($). The data presented here are in compliance with MIQE guidelines [24].
The primers were β-actin (sense: 5’-tgtgatggtgggaatgggtcag-3; antisense: 5’-tttgatgtcacgcacgatttcc-3’) and TNF-alpha (sense: 5’-gcaaaccaccaagcagag-3’; antisense: 5’-cggagaggaggctgactt-3’) [18].
Primary islet cell culture
Islets were isolated from the pancreatic tissue under sterile conditions (as per the protocol of Venkatesan et al (2012). Briefly, the pancreas were removed aseptically without disturbing the surrounding connective tissues in cold RPMI-1640 (GIBCO) pH-7.2 containing antibiotics (100 units/mL penicillin, 0.2 mg/mL streptomycin, and 2.5 mg/L amphotericin). The tissue was minced finely to obtain approximately 1 mm pieces, and digested with 0.5 mg/L filter sterilized collagenase solution prepared in RPMI-1640 medium. The digest was subjected to several washes and the cellular pellet (> 95% islets) was suspended in DMEM with 10% FBS and maintained for 48 h in optimal culture conditions as per Venkatesan et al [15].
Primary acinar cell culture
Pancreas were removed quickly using asceptic methods and the tissue was minced into small fragments and digested in DMEM medium containing collagenase V (0.5 mg/mL) at 37 °C for 30 min with constant shaking as described by the method described earlier [25]. The digest was subjected to several washes and the cellular pellet (> 95% acinar) was suspended in DMEM with 10% fetal bovine serum (FBS) and maintained for 48 h in optimal culture conditions.
In vitro assays
Intracellular reactive oxygen species (ROS) levels were measured for all groups as described earlier [22]. Briefly, 150 islets were incubated in 10 µM dichlorofluorescein diacetate at 37 °C for 30 min and the resulting fluorescence was measured with excitation of 495 nm and emission of 538 nm. Values were reported as fluorescence intensity unit (FIU). All values were corrected by subtracting autofluorescence for respective wells and fluorescent intensities were standardized as per the total protein content.
Inflammmatory markers and acinar cell cycle analysis: flow cytometry
Inflammmatory markers were assessed by flow cytometry. Briefly, 1 mL cell suspension (1 × 10⁶ cells) was incubated for few minutes in rat specific Fc block solution (BD Biosciences, San Jose, CA, USA) followed by incubation with fluorescence-tagged primary antibodies-CD11b-FITC (BD Biosciences), TNF-α-PE (BD Biosciences) and NF-κB-FITC (in 1:100 dilution) at 4 °C for 30 min in dark. Total of 10,000 events were acquired in FACS Aria II and data were analyzed using FACS Diva software. Values have been represented as average percentage positivity of cells carried out from three independent experiments performed in duplicates as reported earlier [13].
The acinar cell cycle was analyzed with flow cytometry. Briefly 1.0 × 10⁶ cells/mL were fixed in 75% ethanol, washed in PBS and incubated with propidium iodide (3 g/L) containing RNase. The percentage of cells in G0-G1, S and G2-M phases was calculated using 488 nm red laser fluorescence and analyzed in BD FACS Aria II (BD Biosciences). Peak fluorescence was gated to discriminate aggregates. The cell cycle analysis was done using FACS Diva Software (BD Biosciences) [14].
In vitro glucose stimulated insulin secretion assay
Isolated islets (250) from all the groups were subjected to glucose stimulated insulin secretion assay at basal (5.5 mmol/L glucose) followed by high glucose challenge (16.5 mmol/L glucose) as described by us earlier [18]. Briefly, primary islet cell cultures were incubated with KRBH buffer containing 5.5 mM followed by 16.5 mM glucose for 1 h each at 37 °C. The insulin secretion was estimated using an ultra-sensitive rat insulin ELISA kit (Mercodia, Uppsala, Sweden).
| Results | ▴Top |
Pancreatitis induction
L-arginine administration (350 mg/100 g body wt) had significant impact on the animals, as demonstrated by an increase in serum lipase and amylase levels in both controls and WNIN/Gr-Ob rats. However, the levels were significantly higher in WNIN/Gr-Ob rats as compared to the controls (Table 1).
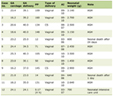 Click to view | Table 1. Effect of L-Arginine Administration on Biochemical Parameters in WNIN and WNIN/GR-Ob Rats |
Pancreatitis induction/biochemical assays
L-arginine administration induced AP in WNIN/Gr-Ob and control rats as demonstrated by an increase in serum lipase and amylase levels. However, no significant difference was found in amylase and lipase levels in WNIN/Gr-Ob and control rats at basal conditions (Table 1).
Interestingly, L-arginine administration also resulted in extra-pancreatic damage including liver and kidney, measured by liver function tests and urea levels. In addition, L-arginine administration decreased albumin/globulin (A/G) ratio, demonstrating decreased synthetic function of the liver (Table 1). Furthermore, induction of pancreatitis altered renal functions and upregulated inflammation with an increase in the global oxidative marker such as TBARS, along with creatinine and urea. These changes were profound in WNIN/Gr-Ob with L-arginine administration as compared to control rats (Table 1).
Histopathology
At the cellular level, L-arginine administration resulted in acinar cell necrosis in both WNIN/Gr-Ob and control rats. However, acinar cell necrosis was more severe in WNIN/Gr-Ob as depicted in Figure 2a. Amylase staining showed that administration of L-arginine increased heterogeneity of amylase staining in both WNIN/Gr-Ob and WNIN rats. However, the heterogeneity was higher in L-arginine administered WNIN/Gr-Ob as compared to WNIN rats treated with L-arginine (Fig. 2b). At the tissue level, there was no evidence for the presence of collagen in the pancreatic tissue (acinar and islet region) of WNIN/GR-Ob and control rats. However, L-arginine induced collagen deposition which was significantly higher in WNIN/Gr-Ob compared to control rats (Fig. 2c). These observations do illustrate for the characteristic of AP and chronic pancreatitis like changes exemplified with fibrotic lesions [26]. Further, L-arginine administration increased vacuoalation in hepatic tissue of WNIN/Gr-Ob as compared to control rats (Fig. 2d), indicating more severe liver injury in WNIN/Gr-Ob rats [27].
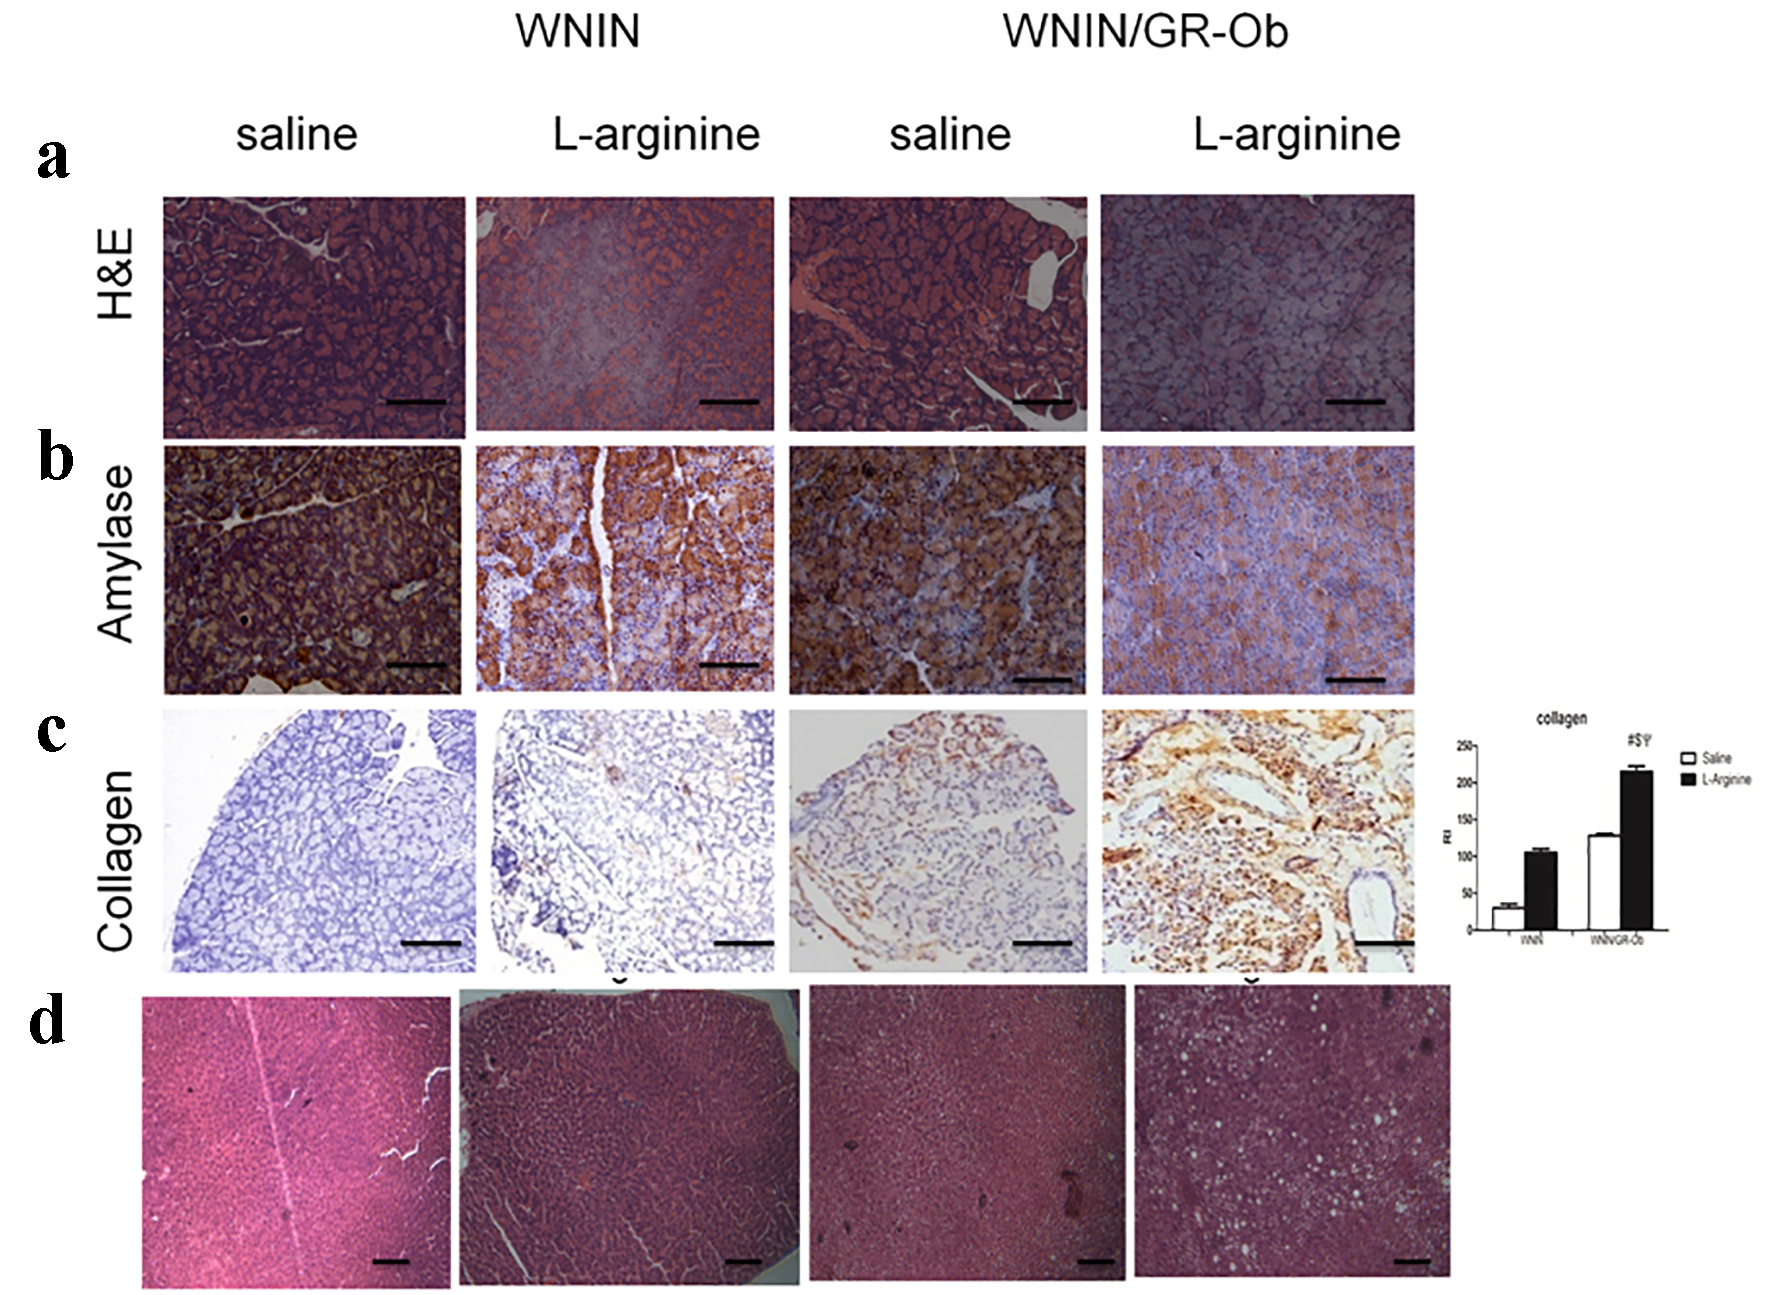 Click for large image | Figure 2. Pathological changes. (a) H&E staining showed increased acinar cell necrosis in WNIN/Gr-Ob administered with L-arginine. (b) Homogenous amylase staining was seen in WNIN rats administered with saline. Administration of L-arginine in WNIN/Gr-Ob and WNIN rats demonstrated increased heterogeneity of amylase staining. The heterogeneity was higher in L-arginine administered WNIN/Gr-Ob as compared to WNIN rats administered with L-arginine. (c) Increased collagen staining was observed in WNIN/Gr-Ob treated with L-arginine as compared to other groups. (d) L-arginine increased vacuoalation in hepatic tissue of WNIN/Gr-Ob rats as compared to control rats. # indicates a significant increase (P < 0.05) as compared to WNIN rats treated with saline, $ denotes a significant increase (P < 0.05) as compared to L-arginine treated WNIN rats, and ѱ indicates a significant increase (P < 0.05) as compared to mutants with saline treatment. |
Oxidative stress markers
It has been well documented that free radicals are mediators of pancreatic damage in AP and their levels correlate with extent of tissue damage. Increased TBARS and ROS are markers for oxidative stress caused by increased generation of free radicals. We observed increased TBARS (Table 1) and ROS levels in the pancreatic tissues of WNIN/Gr-Ob rats in both basal and with L-arginine induction as compared to their respective controls (Fig. 3a), which is in line with previous findings [18].
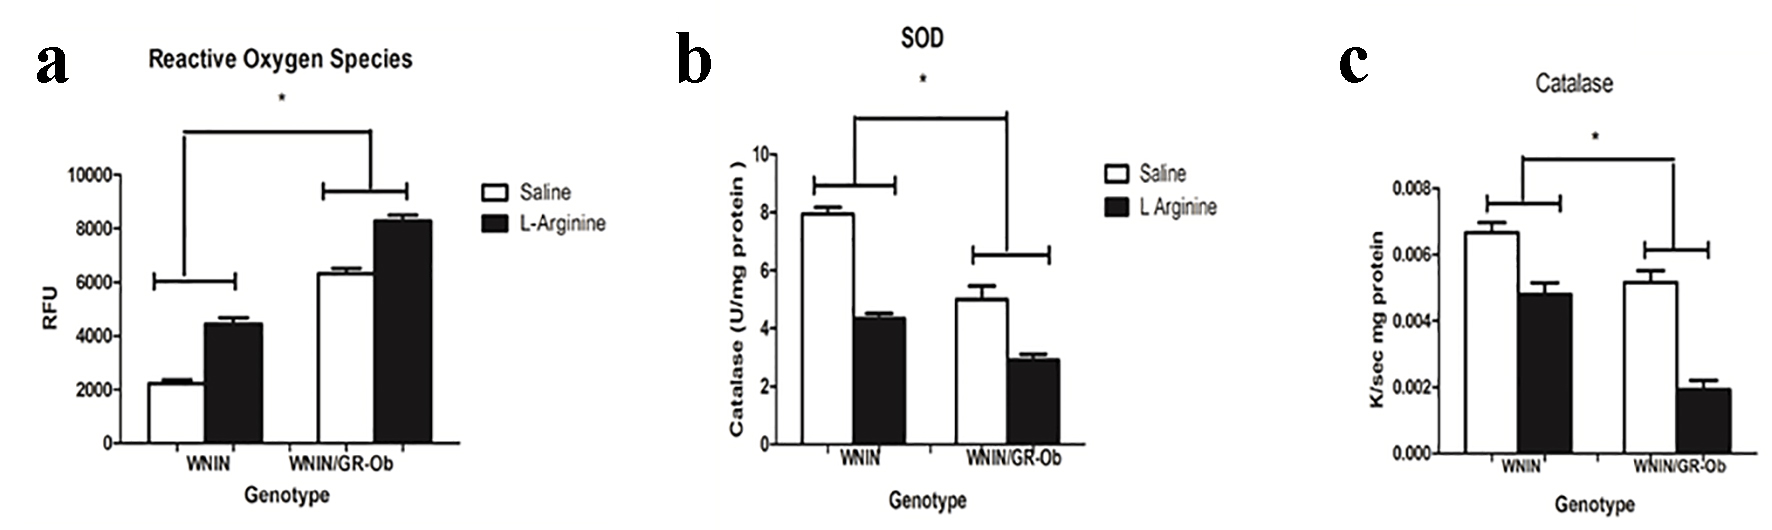 Click for large image | Figure 3. Oxidative stress. (a) ROS was highest in WNIN/Gr-Ob rats as compared to other groups. (b) Lowest superoxide dismutases level-antioxidant enzyme was observed in WNIN/Gr-Ob administered with L-arginine compared to other groups. (c) Pronounced decrease in catalase levels (antioxidant) was observed in L-arginine-induced pancreatitis in WNIN/Gr-Ob rats compared to other groups. *P < 0.05. |
Decreased antioxidant levels are an indicator of increased ROS generation and progression of pancreatitis. A significant decrease in SOD levels (Fig. 3b) and catalase (Fig. 3c) was demonstrated in WNIN/Gr-Ob rats with L-arginine treatment. Interestingly, WNIN/Gr-Ob at basal conditions (saline treatment) also demonstrated decreased antioxidant status as compared to control rats.
Inflammatory markers
L-arginine treatment enhanced TNF-alpha mRNA expression in both WNIN and WNIN/Gr-Ob rats and the highest TNF-alpha mRNA levels were detected in WNIN/Gr-Ob rats treated with L-arginine (Fig. 4a). There were significantly higher circulating levels of TBARS (Table 1) and IL-1β (Fig. 4b) in WNIN/Gr-Ob treated with L-arginine as compared to WNIN rats administered with saline or L-arginine. Even at the basal conditions, higher levels of IL-1β and TBARS in WNIN/Gr-Ob rats were seen as compared to control rats (Table 1 and Fig. 4b). These results demonstrate that L-arginine treatment expediated the inflammatory response in WNIN/Gr-Ob rats compared against the control rats.
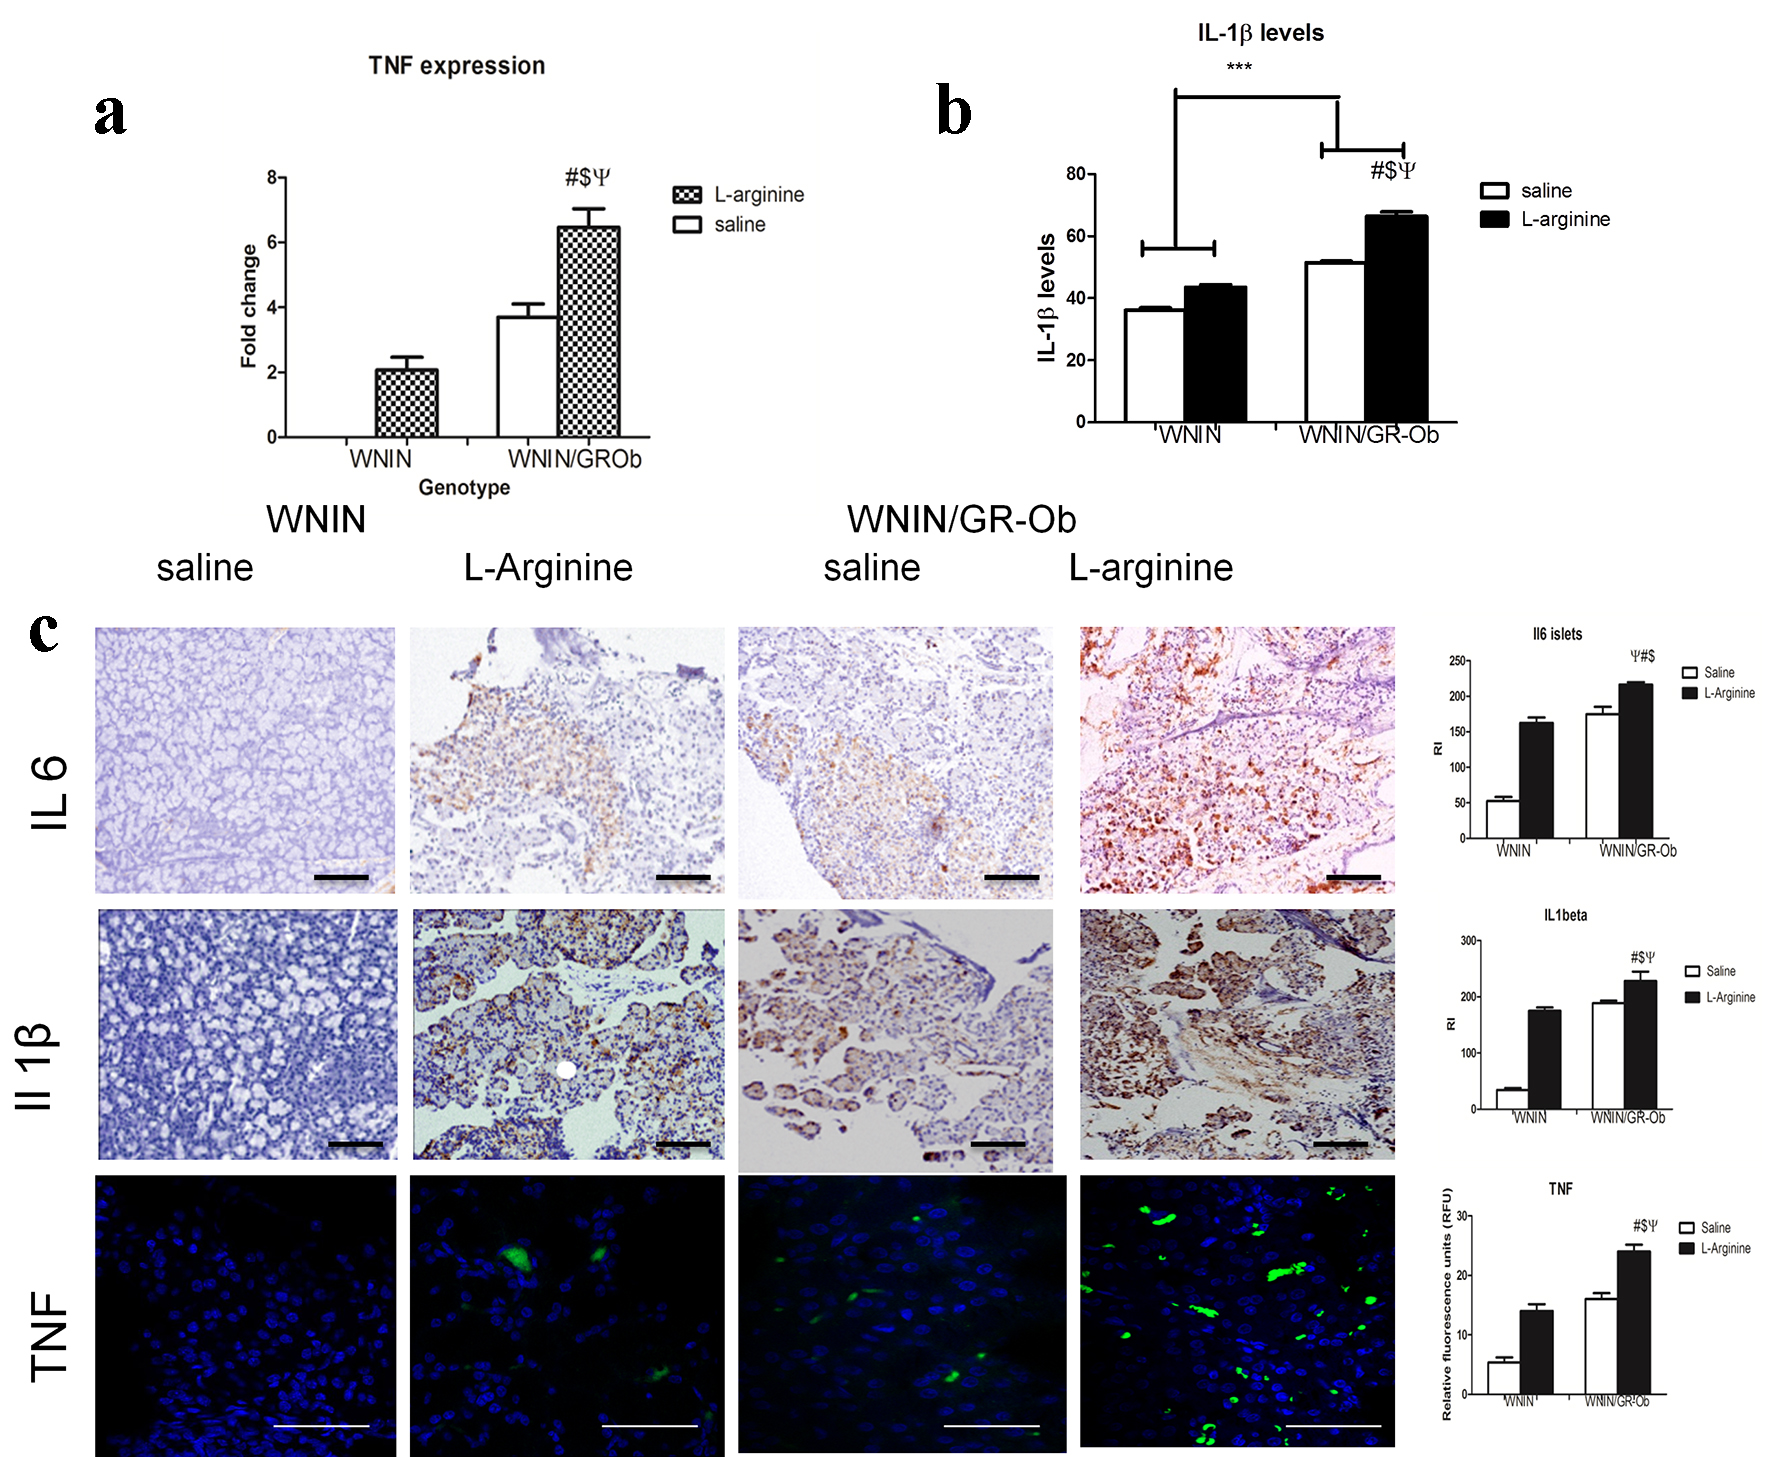 Click for large image | Figure 4. Inflammatory markers. (a) Relative TNF-alpha mRNA levels among the groups are presented as fold changes. mRNA levels for TNF-alpha were significantly upregulated in WNIN/Gr-Ob rats administered with L-arginine. (b) WNIN/Gr-Ob rats administered with L-arginine also showed increased IL-1b protein levels in the serum. (c) Immunolocalization of IL-6, IL-1beta and TNF-alpha in pancratic tissues of all animal groups. # indicates a significant change (P < 0.05) as compared to WNIN rats treated with saline, $ denotes a significant change (P < 0.05) as compared to L-arginine treated WNIN rats, and ѱ indicates a significant change (P < 0.05) as compared to WNIN/Gr-Ob with saline treatment. |
In similar lines, expression levels of inflammatory molecules (IL-6, IL-1β and TNF) in exocrine fraction of WNIN/Gr-Ob rats were significantly higher when administered with L-arginine as confirmed by immunohistochemistry (Fig. 4c).
The expression of TNF-alpha, NF-κB in acinar cells and macrophage CD11b was measured by FACS. L-arginine treatment resulted in an increase of all these proteins in cells from WNIN as well as WNIN/Gr-Ob rats, but a higher increase was detected in cells from WNIN/Gr-Ob rats compared with those from WNIN rats (Fig. 5).
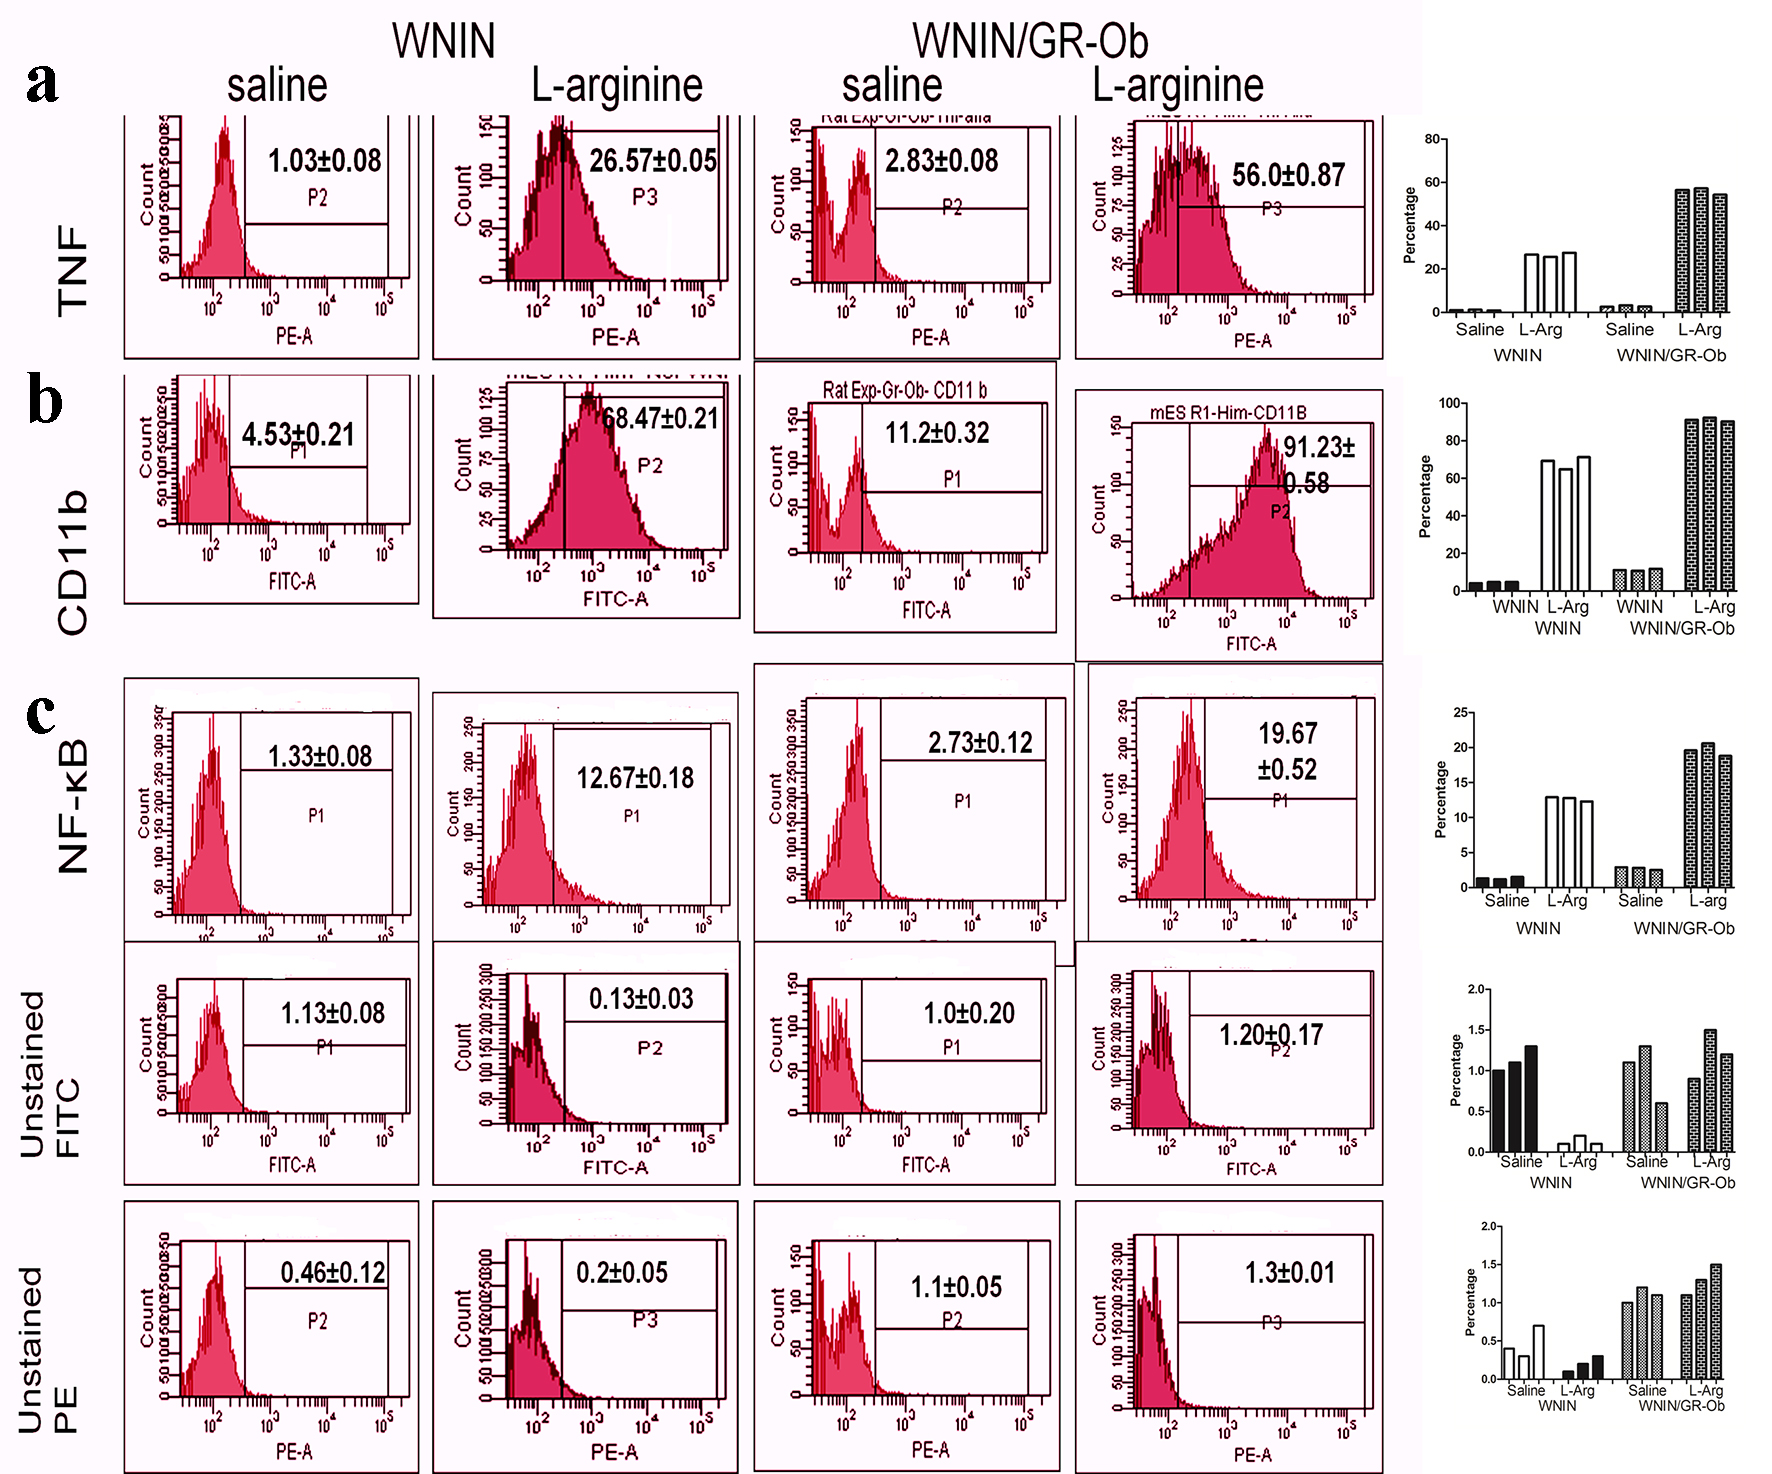 Click for large image | Figure 5. Expression of inflammatory markers (TNF, CD11b and NF-κB) assessed by flow cytometry. Increased TNF, CD11b and NF-κB expression was detected in WNIN/Gr-Ob administered with L-arginine as compared to other groups. A representative flow cytometric histogram for each molecule detected in each group was shown in left panels. Shown in the right plots were results of three independent assays for each molecule from all groups of animals. |
Cell cycle analysis
Administration of larginine increased acinar cells in G1 phase in both WNIN/Gr-Ob rats and control rats. However, at basal conditions (saline treatment) controls had more cells in “S” phase and WNIN/Gr-Ob had more cells in G2/M phase (Fig. 6).
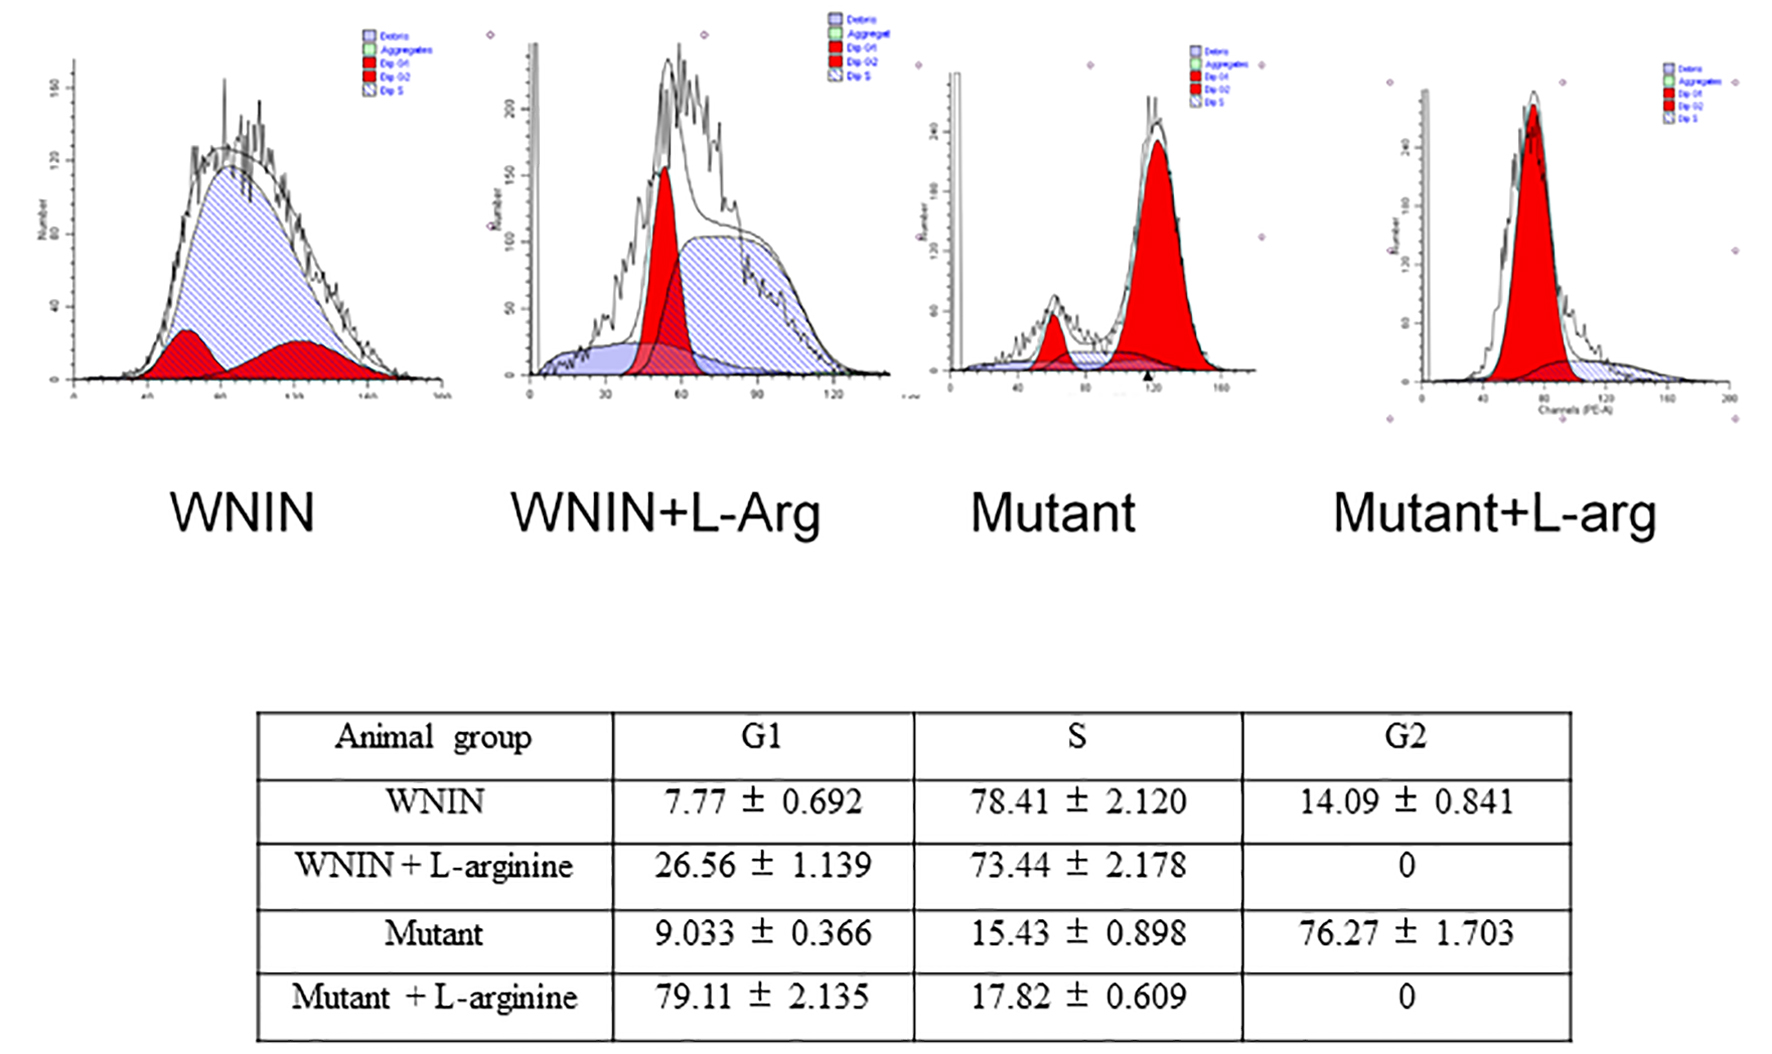 Click for large image | Figure 6. Cell cycle analysis of isolated acinar cells. The figure shows the effect of L-arginine admininistration on acinar cell cycles. The data were computed from three independent experiments. |
Islet characteristics
L-arginine treatment induced increased expression of IL-6 and IL-1β (immunohistochemistry) in islets of WNIN/Gr-Ob rats compared to controls rats. However, increased expression of IL-6 and IL-1β were also demonstrated in the islets of WNIN/Gr-Ob at basal conditions, indicating the preinflammatory milieu in WNIN/Gr-Ob rats compared to control rats (Fig. 7a).
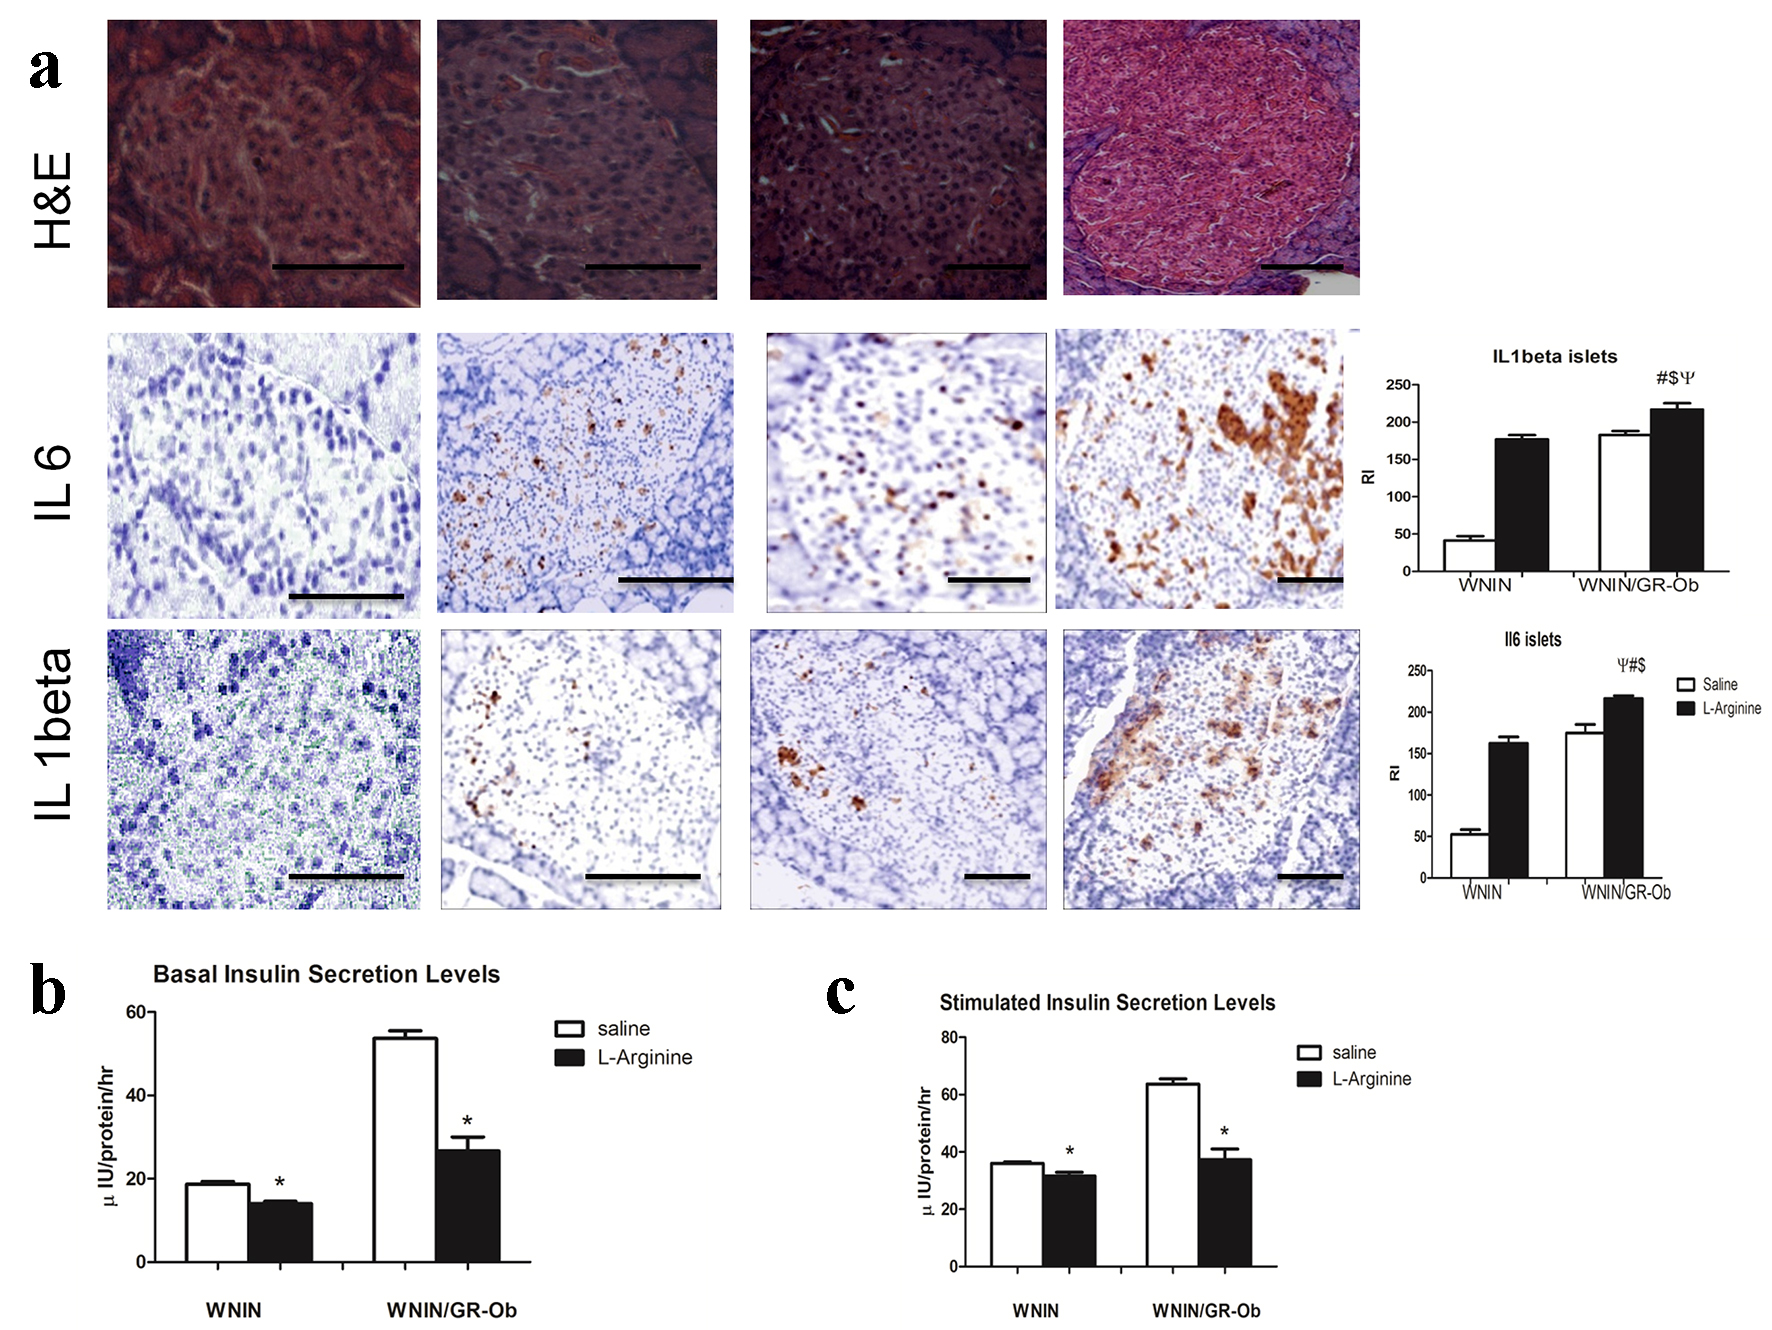 Click for large image | Figure 7. Islet characteristics. (a) Immunolocalization of IL-1β and IL-6 in islets revealed upregulated levels of both molecules in WNIN/Gr-Ob administered with L-arginine as compared to other groups. (b) Insulin secretion assay revealed decreased insulin secretion at basal levels both in WNIN/Gr-Ob as well as WNIN rats when admininistered with L-arginine. (c) Stimulatory index was also decreased in WNIN and WNIN/Gr-Ob rats when L-arginine was administered. # indicates a significant change (P < 0.05) as compared to WNIN rats treated with saline, $ denotes a significant change (P < 0.05) as compared to L-arginine treated WNIN rats, and ѱ indicates a significant change (P < 0.05) as compared to WNIN/Gr-Ob with saline treatment. * indicates a significant reduction compared to saline treated animals. |
Insulin secretion assay
Insulin secretion of the islets is an important hall mark status of its functional response [18]. L-arginine administration altered insulin secretion in both control and WNIN/Gr-Ob rats. However, the magnitude of decrease with insulin secretion was greater in WNIN/Gr-Ob rats as compared to control rats (Fig. 7b, c).
| Discussion | ▴Top |
AP is an inflammation disease of the exocrine gland of pancreas causing systemic as well as local complications, needing emergency and hospital admission [28]. Studies have demonstrated that MS is associated with the precipitation and severity of AP [29]. Our previous studies have also reported increased episodes of obesity-associated neurodegeneration, cataract, cancer, infertility and immune dysfunction and accelerated aging in WNIN/Gr-Ob rats [30]. In line with our hypothesis, L-arginine treatment caused significantly higher alterations in histopathological/biochemical parameters in WNIN/Gr-Ob as compared to their parental control rats. This has been evidenced by 1) increased acinar cell necrosis, 2) increased serum amylase and lipase, 3) higher hepatic damage, 4) altered liver function test, 5) increased kidney damage, 6) increase in serum urea and creatinine, 7) altered distribution of pancreatic cells, 8) increased vacoulation and irregular islets, and 9) mild fibrosis in exocrine regions.
L-arginine is a choice of molecule to induce AP as it causes dose-dependent selective necrosis of acinar cells by ROS and ER stress, also by inhibiting polyamine synthesis in acinar cells resulting in inhibition of protein metabolism [31, 32]. Severity of AP has been predicted by the magnitude of local and systemic inflammatory cytokine production [33] and several reports have well documented for over activation of leukocytes being the major contributor of inflammation leading to multiple organ dysfunction syndrome [34]. Interestingly, we have earlier reported for the predominance of the inflammatory milieu of the pancreas [17, 18], adipose [35] and bone marrow in WNIN/Gr-Ob rats [14] and probably this may be an important confounding factor to predispose WNIN/Gr-Ob rats toward development of pancreatitis, as compared to their age-matched parental control rats [17]. Interestingly, among inflammatory cytokines, IL-1, TNF-α , IL-6 and IL-8 are the major cytokines that initiate and propagate detrimental consequence of AP such as severe inflammation and sepsis [36]. In the present study, WNIN/Gr-Ob treated with L-arginine showed increased expression of inflammatory markers: CD11b, TNF-α, IL-1β, IL-6, NF-κB, compared to control rats in acinar as well as islets (Figs. 4, 5 and 7), suggesting the inflammatory milieu in the pancreas. In similar lines increased severity of pancreatitis was also observed in diet-induced obese mice when administered with IL-12 and IL-18 [37].
Increased expression of Cd11b - a marker of macrophages [38] seen with L-arginine admininistration in WNIN/Gr-Ob rats, might be due to increased influx of inflammatory cells in the exocrine fraction via adhesion molecules [17]. In agreement, our published data from genome-wide expression from the pancreas of WNIN/Gr-Ob rats further confirm the pre-dominance of ER stress, as the major inflammatory response underlying in WNIN/Gr-Ob rats [17]. In addition, inflammatory cytokines and transcription factors have also been shown to be upregulated in taurocholate-induced AP in obese zucker rats leading to increased oxidative stress, fat necrosis and isoprostanes levels, as compared to lean controls [7].
Increased free radical induced oxidative stress plays a pivotal role in pathogenesis of many diseases including obesity, T2D and AP [7, 39-43] leading to macromolecular damage (DNA, protein and lipids), inflammation, ER stress and necrosis of acinar cells [44]. Interestingly, amongst all the organs, pancreas are equipped with weak antioxidant mechanism(s) and deleterious effects of oxidative stress can be prevented by antioxidative enzymes [22], thus helping in maintenance of ROS levels to normal physiological concentrations. Endogenous antioxidant defense system regulates the level of ROS to maintain normal physiological homeostasis of free radical scavengers. CAT and SOD provide significant protection to pancreas [45]. SOD removes superoxide radicals by converting them into H2O2 that is rapidly converted to water by CAT. Therefore, decrease in activity of these enzymes in WNIN/Gr-Ob rats at basal conditions, may be a primary reason for the acceleration of the pancreatic injury presently observed with L-arginine induction (Fig. 8). Co-precipitating of fibrotic lesions as demonstrated by collagen expression in acinar cells may be attributed to defence mechanism against inflammatory cytokine-induced pancreatic injury and inflammation [26]; interestingly, the collagen expression was restored when pancreatic inflammation was relieved [46].
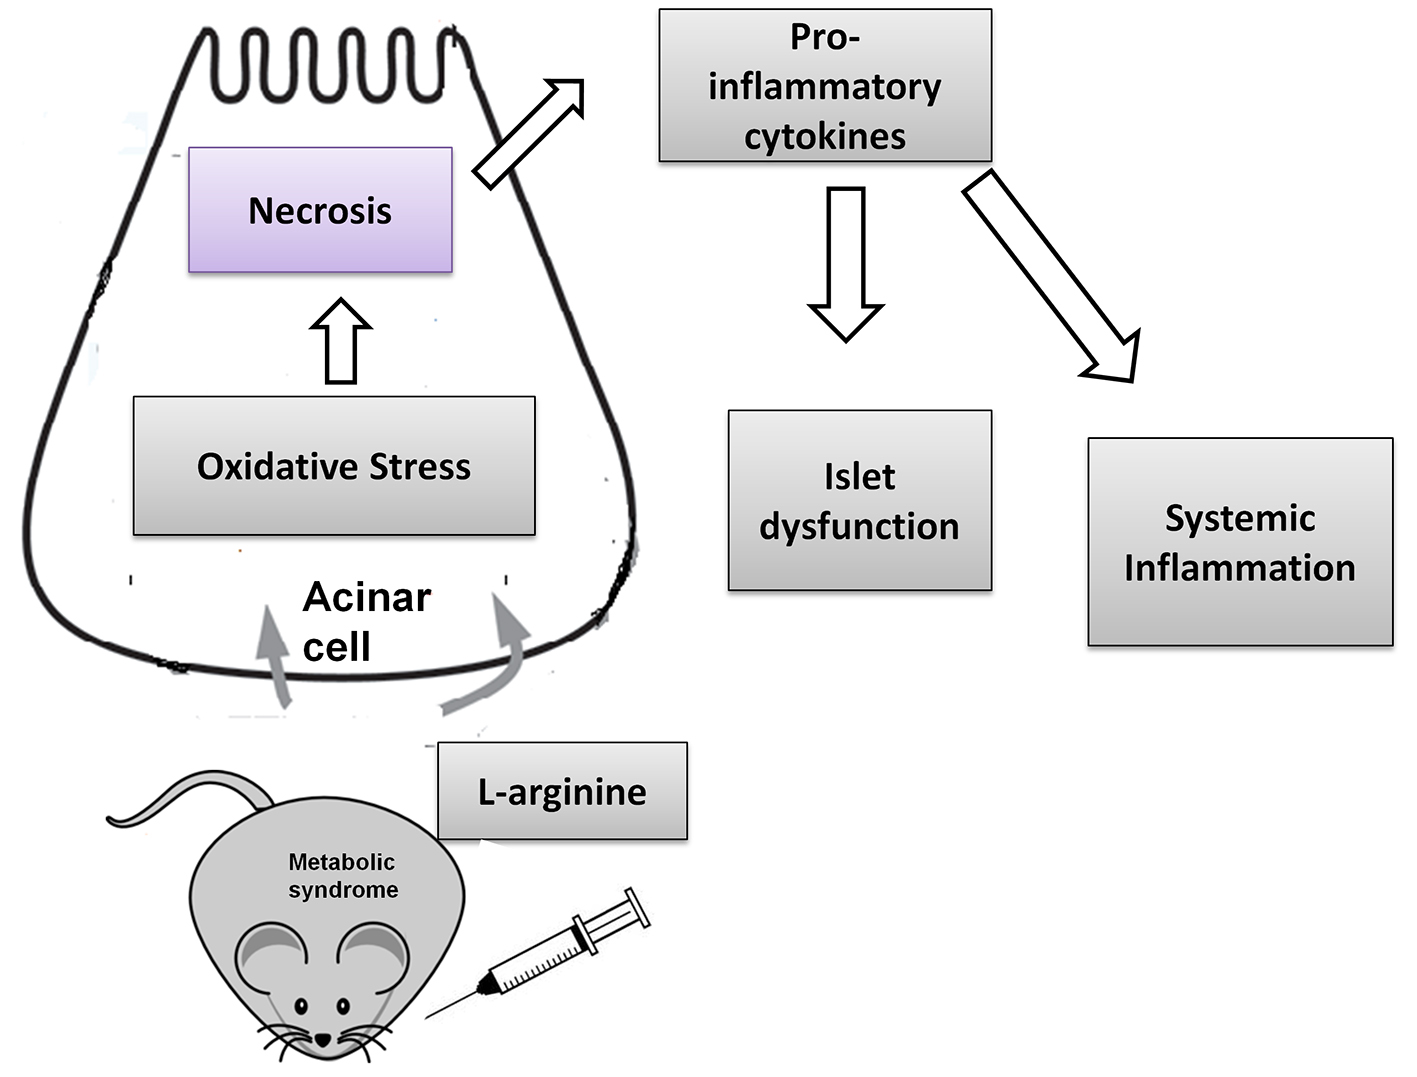 Click for large image | Figure 8. L-arginine induces severe acute pancreatitis in WNIN/GR-Ob rats. The pancreatitis induction may be attributed to increased necrosis of acinar cells and inflammatory cytokines leading to increased systemic inflammation and islet dysfunction. |
Exocrine and endocrine components are structurally and functionally interrelated. Diseases of exocrine pancreas such as chronic pancreatitis and AP adversely affect endocrine function and may lead to diabetes [47]. Pancreatitis and secondary diabetes are observed in WBN/KOb rats [48] and severity of pancreatitis and diabetes increases in WBN/Kob-Leprfa strain with homozygous fa/fa trait (genetic obesity), as compared to parental WBN/KOb rats. These homozygous (fa/fa) WBN/Kob-Leprfa rats with obesity develop pancreatitis at the age of 7 - 9 weeks compared to 3 months in WBN/Kob rats, and develop diabetes by the age of 3 - 4 months as compared to 9 months in male WBN/Kob rats [49]. In par with these studies, the propensity to increase the levels of inflammatory cytokines (IL-6 and IL-1β) expression in islets of WNIN/Gr-Ob rats were exacerbated with L-arginine administration in mutants.
Islet function is assessed by its ability to respond to glucose challenge [22], and very interestingly the stimulatory responses of the islets were attenuated in WNIN/Gr-Ob administered with L-arginine compared to control rats. We also have earlier reported for an impaired response in WNIN/Gr-Ob rats at basal condition [18]. Probably, these perturbations noted with islet cell functions could be a multifactorial effect and can be attributed to a reduced threshold of the beta-cells reported under MS [18] that can all be accelerated with the induction of AP by L-arginine. Further studies are needed to gain an insight to delineate the endocrine-exocrine cross-talk underlying inflammation in WNIN/Gr-Ob rats.
Conclusion
Obesity is associated with increased severity of pancreatitis. Pancreatic inflammation present at basal state predisposes the obese rats to severe acute pancreatitis. We here demonstrate the promise(s) of WNIN/Gr-Ob rats to study the pathophysiology of AP with L-arginine induction, as our study is in line with human studies.
| References | ▴Top |
- Yadav D, Lowenfels AB. The epidemiology of pancreatitis and pancreatic cancer. Gastroenterology. 2013;144(6):1252-1261.
doi pubmed pmc - Gonzalez-Perez A, Schlienger RG, Rodriguez LA. Acute pancreatitis in association with type 2 diabetes and antidiabetic drugs: a population-based cohort study. Diabetes Care. 2010;33(12):2580-2585.
doi pubmed pmc - Su KH, Cuthbertson C, Christophi C. Review of experimental animal models of acute pancreatitis. HPB (Oxford). 2006;8(4):264-286.
doi pubmed pmc - Lerch MM, Gorelick FS. Models of acute and chronic pancreatitis. Gastroenterology. 2013;144(6):1180-1193.
doi pubmed - Kubisch CH, Logsdon CD. Endoplasmic reticulum stress and the pancreatic acinar cell. Expert Rev Gastroenterol Hepatol. 2008;2(2):249-260.
doi pubmed - Kubisch CH, Sans MD, Arumugam T, Ernst SA, Williams JA, Logsdon CD. Early activation of endoplasmic reticulum stress is associated with arginine-induced acute pancreatitis. Am J Physiol Gastrointest Liver Physiol. 2006;291(2):G238-245.
doi pubmed - Pereda J, Perez S, Escobar J, Arduini A, Asensi M, Serviddio G, Sabater L, et al. Obese rats exhibit high levels of fat necrosis and isoprostanes in taurocholate-induced acute pancreatitis. PLoS One. 2012;7(9):e44383.
doi pubmed pmc - Mateu A, Ramudo L, Manso MA, Closa D, De Dios I. Acinar inflammatory response to lipid derivatives generated in necrotic fat during acute pancreatitis. Biochim Biophys Acta. 2014;1842(9):1879-1886.
doi pubmed - Giridharan NV. Animal models of obesity & their usefulness in molecular approach to obesity. Indian J Med Res. 1998;108:225-242.
pubmed - Sinha JK, Ghosh S, Swain U, Giridharan NV, Raghunath M. Increased macromolecular damage due to oxidative stress in the neocortex and hippocampus of WNIN/Ob, a novel rat model of premature aging. Neuroscience. 2014;269:256-264.
doi pubmed - Kalashikam RR, Inagadapa PJ, Thomas AE, Jeyapal S, Giridharan NV, Raghunath M. Leptin gene promoter DNA methylation in WNIN obese mutant rats. Lipids Health Dis. 2014;13:25.
doi pubmed pmc - Kalashikam RR, Battula KK, Kirlampalli V, Friedman JM, Nappanveettil G. Obese locus in WNIN/obese rat maps on chromosome 5 upstream of leptin receptor. PLoS One. 2013;8(10):e77679.
doi pubmed pmc - Harishankar N, Vajreswari A, Giridharan NV. WNIN/GR-Ob - an insulin-resistant obese rat model from inbred WNIN strain. Indian J Med Res. 2011;134:320-329.
pubmed pmc - Madhira SL, Challa SS, Chalasani M, Nappanveethl G, Bhonde RR, Ajumeera R, Venkatesan V. Promise(s) of mesenchymal stem cells as an in vitro model system to depict pre-diabetic/diabetic milieu in WNIN/GR-Ob mutant rats. PLoS One. 2012;7(10):e48061.
doi pubmed pmc - Venkatesan V, Chalsani M, Nawaz SS, Bhonde RR, Challa SS, Nappanveettil G. Optimization of condition(s) towards establishment of primary islet cell cultures from WNIN/Ob mutant rat. Cytotechnology. 2012;64(2):139-144.
doi pubmed pmc - Venkatesan V, Madhira SL, Malakapalli VM, Chalasani M, Shaik SN, Seshadri V, Kodavalla V, et al. Obesity, insulin resistance, and metabolic syndrome: a study in WNIN/Ob rats from a pancreatic perspective. Biomed Res Int. 2013;2013:617569.
doi pubmed pmc - Singh H, Giridharan N, Bhonde R, Venkatesan V. Deriving at candidate genes of metabolic stress from pancreas of WNIN/GR-Ob mutant rats. Islets. 2013;5(4):133-138.
doi pubmed - Singh H, Ganneru S, Malakapalli V, Chalasani M, Nappanveettil G, Bhonde RR, Venkatesan V. Islet adaptation to obesity and insulin resistance in WNIN/GR-Ob rats. Islets. 2014;6(5-6):e998099.
doi pubmed pmc - Hardman J, Jamdar S, Shields C, McMahon R, Redmond HP, Siriwardena AK. Intravenous selenium modulates L-arginine-induced experimental acute pancreatitis. JOP. 2005;6(5):431-437.
pubmed - Misra HP, Fridovich I. The role of superoxide anion in the autoxidation of epinephrine and a simple assay for superoxide dismutase. J Biol Chem. 1972;247(10):3170-3175.
pubmed - Kakkar R, Mantha SV, Radhi J, Prasad K, Kalra J. Increased oxidative stress in rat liver and pancreas during progression of streptozotocin-induced diabetes. Clin Sci (Lond). 1998;94(6):623-632.
doi - Kiran SG, Dorisetty RK, Umrani MR, Boindala S, Bhonde RR, Chalsani M, Singh H, et al. Pyridoxal 5' phosphate protects islets against streptozotocin-induced beta-cell dysfunction--in vitro and in vivo. Exp Biol Med (Maywood). 2011;236(4):456-465.
doi pubmed - Leong DJ, Choudhury M, Hanstein R, Hirsh DM, Kim SJ, Majeska RJ, Schaffler MB, et al. Green tea polyphenol treatment is chondroprotective, anti-inflammatory and palliative in a mouse post-traumatic osteoarthritis model. Arthritis Res Ther. 2014;16(6):508.
doi pubmed pmc - Taylor S, Wakem M, Dijkman G, Alsarraj M, Nguyen M. A practical approach to RT-qPCR-Publishing data that conform to the MIQE guidelines. Methods. 2010;50(4):S1-5.
doi pubmed - Husain SZ, Prasad P, Grant WM, Kolodecik TR, Nathanson MH, Gorelick FS. The ryanodine receptor mediates early zymogen activation in pancreatitis. Proc Natl Acad Sci U S A. 2005;102(40):14386-14391.
doi pubmed pmc - Gong J, Wang Y, Jiang R, Zhang G, Tian F. The naive effector cells of collagen type I during acute experimental pancreatitis are acinar cells and not pancreatic stellate cells. Biochem Biophys Res Commun. 2013;439(4):528-532.
doi pubmed - Nayak NC, Sathar SA, Mughal S, Duttagupta S, Mathur M, Chopra P. The nature and significance of liver cell vacuolation following hepatocellular injury--an analysis based on observations on rats rendered tolerant to hepatotoxic damage. Virchows Arch. 1996;428(6):353-365.
doi pubmed - Jha RK, Ma Q, Sha H, Palikhe M. Acute pancreatitis: a literature review. Med Sci Monit. 2009;15(7):RA147-156.
pubmed - Mikolasevic I, Milic S, Orlic L, Poropat G, Jakopcic I, Franjic N, Klanac A, et al. Metabolic syndrome and acute pancreatitis. Eur J Intern Med. 2016;32:79-83.
doi pubmed - Harishankar N, Kumar PU, Sesikeran B, Giridharan N. Obesity associated pathophysiological & histological changes in WNIN obese mutant rats. Indian J Med Res. 2011;134:330-340.
pubmed pmc - Abdin AA, El-Hamid MA, El-Seoud SH, Balaha MF. Effect of pentoxifylline and/or alpha lipoic acid on experimentally induced acute pancreatitis. Eur J Pharmacol. 2010;643(2-3):289-296.
doi pubmed - Hyvonen MT, Herzig KH, Sinervirta R, Albrecht E, Nordback I, Sand J, Keinanen TA, et al. activated polyamine catabolism in acute pancreatitis: alpha-methylated polyamine analogues prevent trypsinogen activation and pancreatitis-associated mortality. Am J Pathol. 2006;168(1):115-122.
doi pubmed pmc - Al Mofleh IA. Severe acute pancreatitis: pathogenetic aspects and prognostic factors. World J Gastroenterol. 2008;14(5):675-684.
doi pubmed pmc - Bhatia M, Wong FL, Cao Y, Lau HY, Huang J, Puneet P, Chevali L. Pathophysiology of acute pancreatitis. Pancreatology. 2005;5(2-3):132-144.
doi pubmed - Madhira SL, Nappanveethl G, Kodavalla V, Venkatesan V. Comparison of adipocyte-specific gene expression from WNIN/Ob mutant obese rats, lean control, and parental control. Mol Cell Biochem. 2011;357(1-2):217-225.
doi pubmed - Granger J, Remick D. Acute pancreatitis: models, markers, and mediators. Shock. 2005;24(Suppl 1):45-51.
doi pubmed - Pini M, Sennello JA, Cabay RJ, Fantuzzi G. Effect of diet-induced obesity on acute pancreatitis induced by administration of interleukin-12 plus interleukin-18 in mice. Obesity (Silver Spring). 2010;18(3):476-481.
doi pubmed pmc - Ramudo L, De Dios I, Yubero S, Vicente S, Manso MA. ICAM-1 and CD11b/CD18 expression during acute pancreatitis induced by bile-pancreatic duct obstruction: effect of N-acetylcysteine. Exp Biol Med (Maywood). 2007;232(6):737-743.
- Alfadda AA, Sallam RM. Reactive oxygen species in health and disease. J Biomed Biotechnol. 2012;2012:936486.
- Singh H. Islet compensation in metabolic stress: lessons from animal models. Curr Diabetes Rev. 2016;12(4):315-321.
doi pubmed - Singh H, Venkatesan V. Beta-cell management in type 2 diabetes: beneficial role of nutraceuticals. Endocr Metab Immune Disord Drug Targets. 2016;16(2):89–98.
doi - Singh H, Parthasarathy V, Farouk M, Venkatesan V. Progenitor cells may aid successful islet compensation in metabolically healthy obese individuals. Med Hypotheses. 2016;86:97-99.
doi pubmed - Singh H, Farouk M, Bose BB, Singh P. Novel genes underlying beta cell survival in metabolic stress. Bioinformation. 2013;9(1):37-41.
doi pubmed pmc - Leung PS, Chan YC. Role of oxidative stress in pancreatic inflammation. Antioxid Redox Signal. 2009;11(1):135-165.
doi pubmed - Jaworek J, Szklarczyk J, Jaworek AK, Nawrot-Porabka K, Leja-Szpak A, Bonior J, Kot M. Protective effect of melatonin on acute pancreatitis. Int J Inflam. 2012;2012:173675.
doi pubmed pmc - Yang L, Shen J, He S, Hu G, Wang F, Xu L, Dai W, et al. L-cysteine administration attenuates pancreatic fibrosis induced by TNBS in rats by inhibiting the activation of pancreatic stellate cell. PLoS One. 2012;7(2):e31807.
doi pubmed pmc - Chakraborty PP, Chowdhury S. A Look inside the pancreas: the “Endocrine-exocrine cross-talk”. Endocrinol Metab Synd. 2015;4:1-4.
doi - Mori M, Fu X, Chen L, Zhang G, Higuchi K. Hereditary pancreatitis model WBN/Kob rat strain has a unique haplotype in the Pdwk1 region on chromosome 7. Exp Anim. 2009;58(4):409-413.
doi pubmed - Akimoto T, Terada M, Shimizu A. Progression of pancreatitis prior to diabetes onset in WBN/Kob-Lepr(fa) rats. J Vet Med Sci. 2012;74(1):65-70.
doi pubmed
This article is distributed under the terms of the Creative Commons Attribution Non-Commercial 4.0 International License, which permits unrestricted non-commercial use, distribution, and reproduction in any medium, provided the original work is properly cited.
Cellular and Molecular Medicine Research is published by Elmer Press Inc.